
You should always supplement the context diagram with a table. This way you can reduce the amount of labels in the diagram and easily add explanations, rationale or cross-references. The comprehensive context diagram above requires such a tabular explanation.
We only show excerpts of the corresponding table, but you should consider some characteristics of this typical “graphics/table” pair:
- You should use short identifiers within the diagram in terms of abstractions or generic terms. We use “Services” or “Market Data” in the example, which are then described in more detail in the table
- Reference within the table to more detailed explanations, e.g. if you are using terms from your domain language, you don’t need to explain them in the context, but refer to the relevant chapter (probably 8.1, domain modell).
See the following example:
| Neighbour | Description |
|---|---|
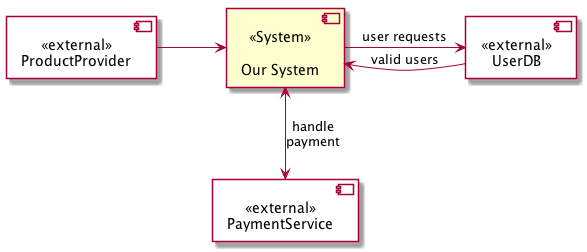
| UserDB | Summarizes all types of users, internal (backoffice), external (customers, partners) |
| ProductProvider | Product provider keeps catalog data, figures, as well as availability, configuration rules, order- and delivery information, and in some cases prices and sources. |
| PaymentService | handles authentication and all other steps required for actual payment. Does NOT involve billing/invoicing. |