A simple diagram with a brief textual explanation.
6. Runtime View
6.1 Processing and Propagation of Measuring Data
The following four diagrams show four different UML diagrams for the same scenario (i.e. the processing and propagation of all measuring data: speedometer pulses, ……)
The key steps in this scenario are the following:
- TPU receives continuous signals from the speedometer.
- Every 40ms (i.e. 25 times per second) the systems measures the distance travelled and updates the bottom line on the screen via the legal inserter.
- Every second the complete pursuit data are calculated and displayed on the bottom and top area of the screen via legal inserter and user inserter.
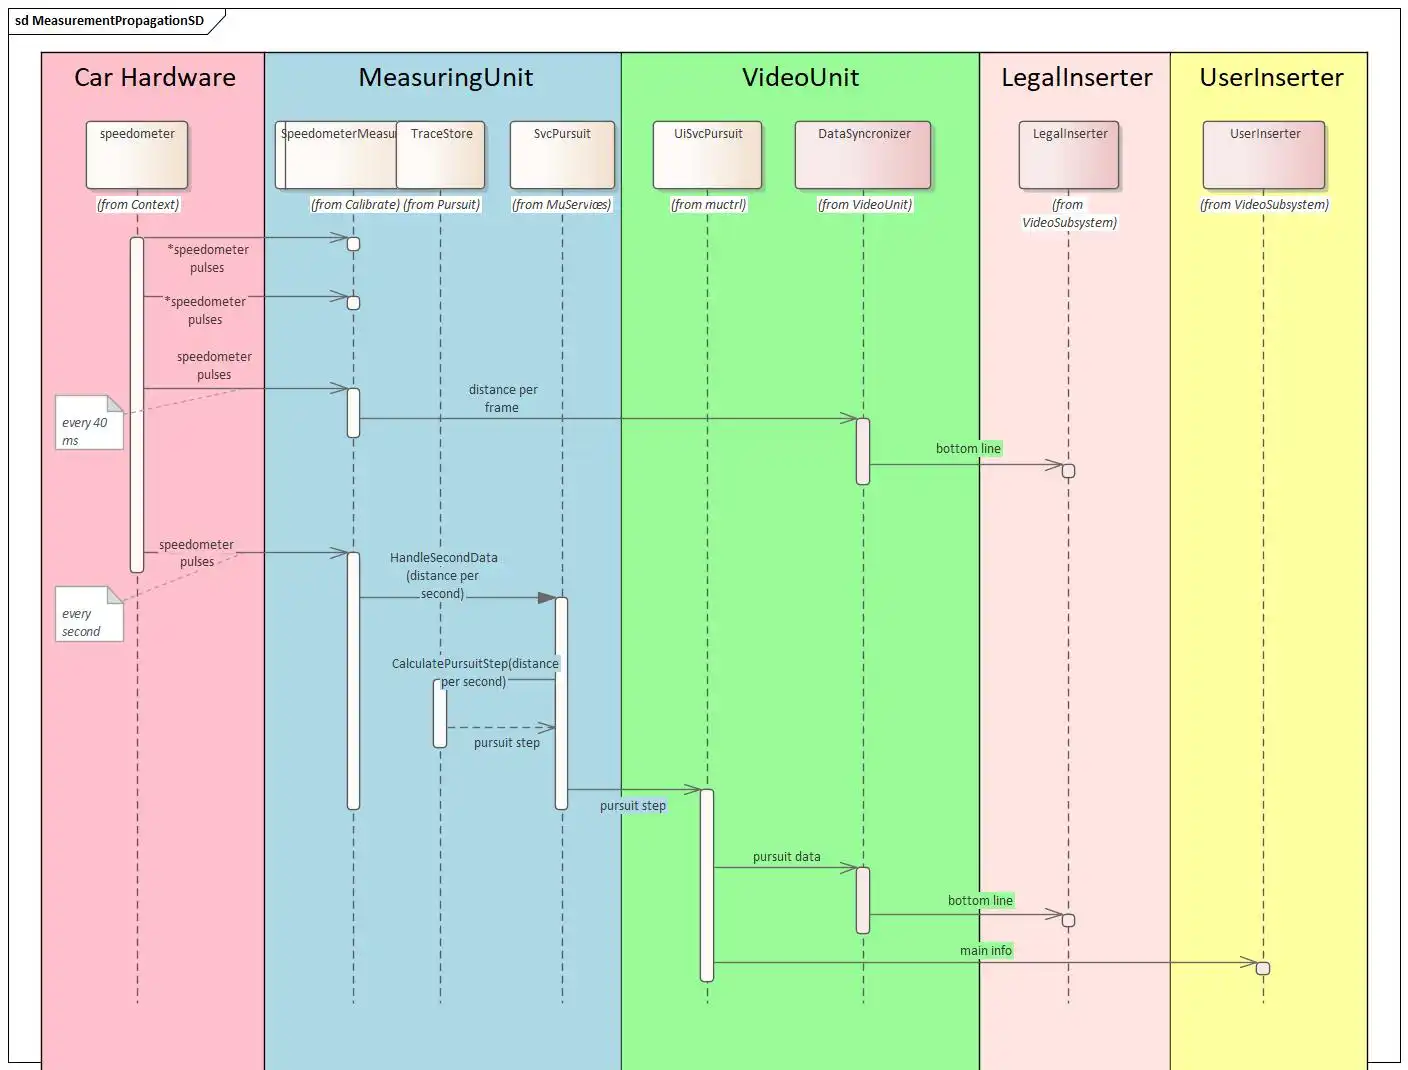
The following sequence diagram shows this process: the repeated measurement of speedometer pulses every 40ms (in the top part of the diagram) and the complete update every second (in the lower part of the diagram).
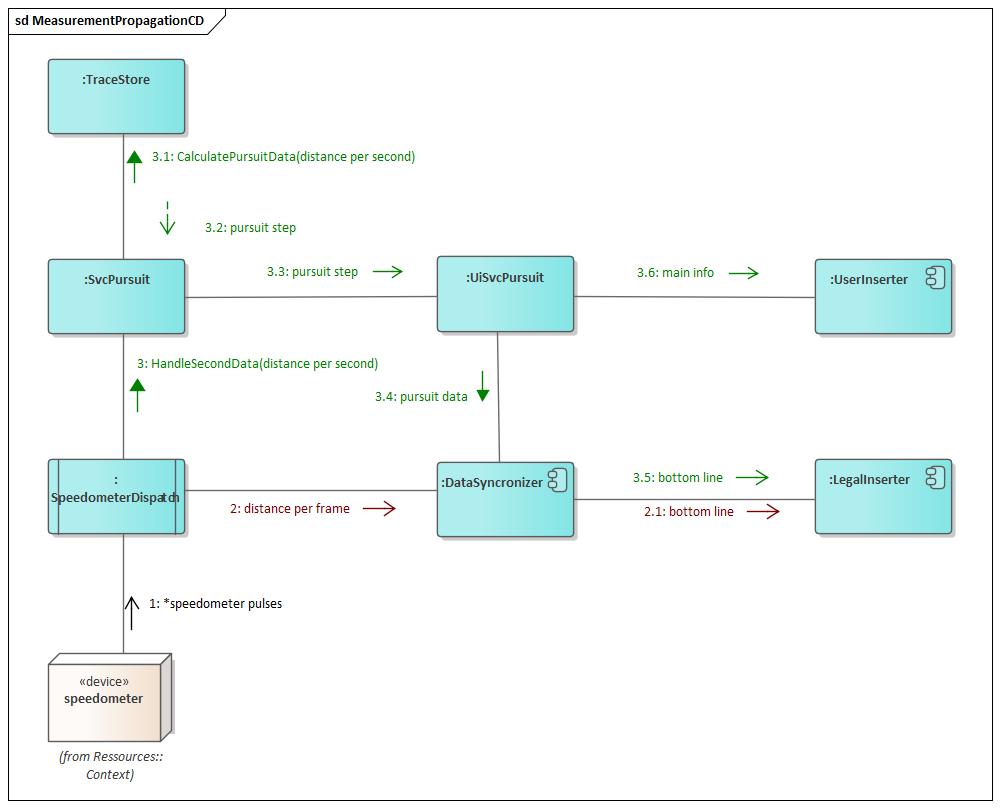
The communication diagram is used in the style of a data flow diagram, showing the original input (speedometer pulses) on the lower left corner and all the calculated intermediate results on their way to the two inserters.
The continuous measurement of the speedometer pulses is marked as step 1 (in black), the propegation of the distance per frame to the legal inserter is shown with red numbers. The final calculation every second is shown with green numbers.
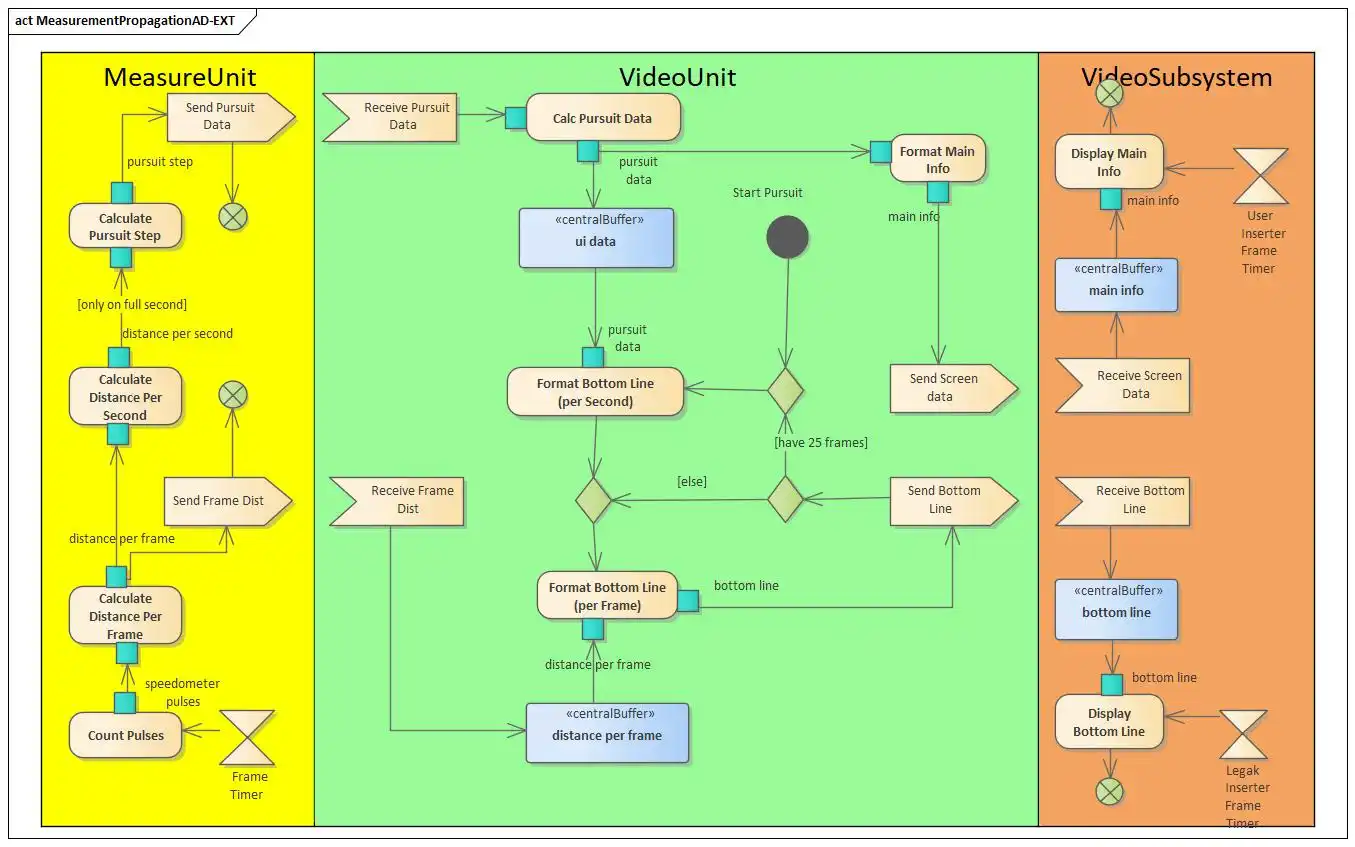
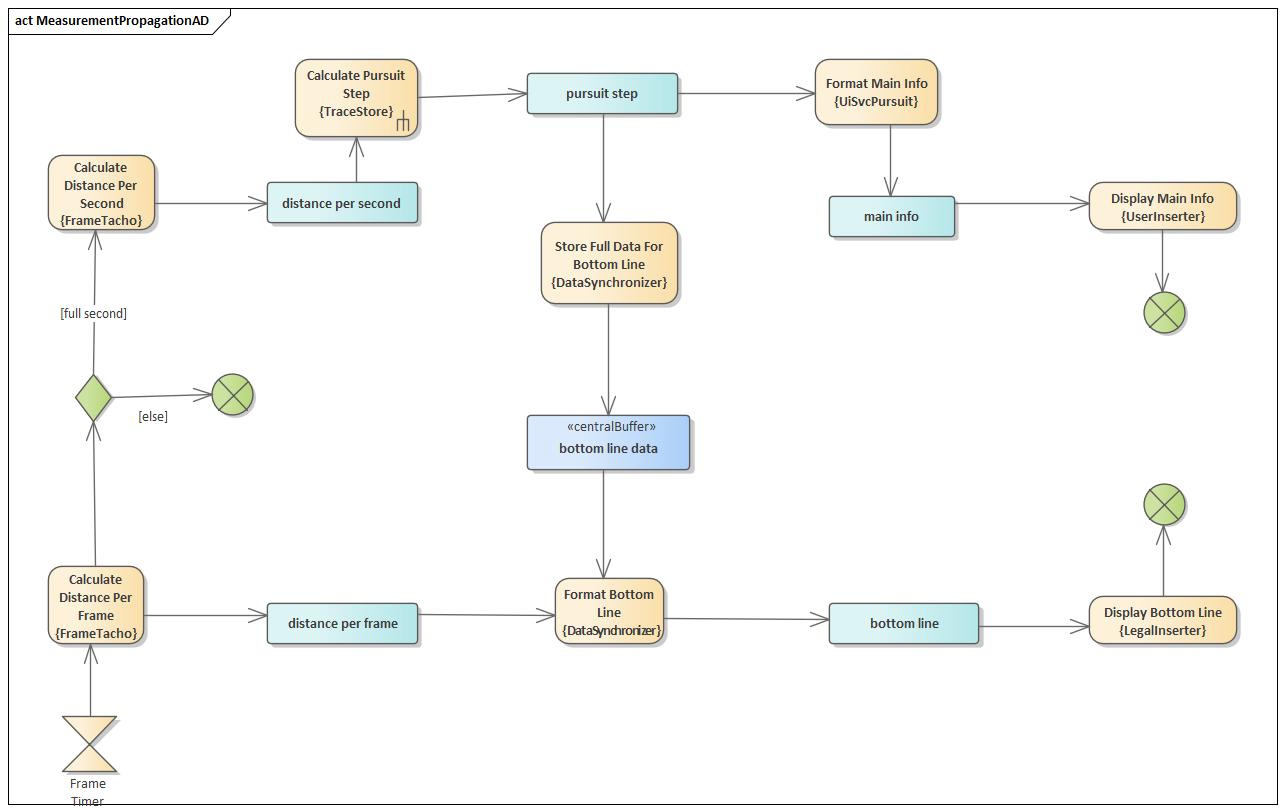
The following activity diagram shows the scenario - ignoring concurrency. It shows the data flows between activities in the building blocks. The names of the building blocks are denoted below the activity names in curly braces.
This extended activity diagram includes the concurrency by showing asynchonously communicating activity diagrams (using the “send-signal-action” and “accept-event-action” symbols of the UML). The diagram is overlaid with swim lanes of the level-1 building blocks.